India Population 2013

india-population-2013India Population 2013

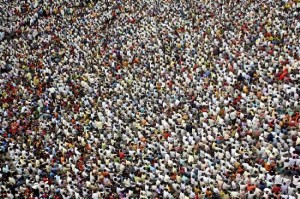
The current population of the Republic of India is estimated to be about 1.27 billion people, which is an increase of about 2.3% from the last record of the population.  Historically over the last half of a century, the population of India has been less than the population of China.  However, in recent years, the population of India has been increasing much more than the population of China has, so the population gap is slowing decreasing between the two countries.  Based on the total land area and the total population of the country, the population density of India is about 1001 people per square mile.

Demographics of India

There are six main ethnic groups that make up the majority of the population of the Republic of India: Negritos, Austrics, Mongoloids, Dravidians, Western Bracycephals, and the Nordics.  The Negritos is the oldest ethnic group in India, coming over from Africa.  The Austrics came to India next and ended up creating the foundation for the country and the culture.  There are two major languages in the country of India: Indo-Aryan and Dravidian.  The majority of the population speaks Indo-Aryan, while only 24% of the population speaks Dravidian.  There are other indigenous languages spoken among minority populations in the country.

Religion in India

The largest religious group in the Republic of India is Hinduism, which makes up about 80% of the population.  In fact, Hinduism actually began in India.  However, two other religions began in India: Buddhism and Jainism.  However, only about 0.4% of the population identifies as a Jain and only about 0.7% of the population is Buddhist.   Another religion found in India is Sikhism, which makes up about 2% of the population.  Islam makes up about 12% of the population, which is the second largest religion in the country.  Christianity only makes up about 2.5% of the population.

Animals of India

India is the home of hundreds of species of mammals, reptiles, and thousands of birds. The varied climate and landscape make it an ideal place for the wildlife. The rivers and the dense forests of the western India add to the ecosystem, encouraging further growth. To protect these animals, India has many wildlife sanctuaries and protection laws. Currently, there are about 80 national parks and 441 sanctuaries. One of the most famous of these is Project Tiger, intended to protect the Bengal tiger, India’s national animal.

Bengal tigers live in India and are sometimes called Indian tigers. There are smaller populations of Bengal tigers in Bangladesh, Nepal, Bhutan, China and Myanmar. It is the most numerous of all tiger subspecies with fewer than 2,500 left in the wild. The creation of India’s tiger reserves in the 1970s helped to stabilize numbers, but poaching to meet a growing demand from Asia in recent years has once again put the Bengal tiger at risk. They are the most common tiger and number about half of all wild tigers. Over many centuries they have become an important part of Indian tradition and lore. These tigers live alone and aggressively scent-mark large territories to keep their rivals away. They are powerful nocturnal hunters that travel many miles to find buffalo, deer, wild pigs, and other large mammals.

Languages in India

India has no official national language. The official language of the Union Government of Republic of India is Standard Hindi, while English is the secondary official language. The constitution of India states that “The official language of the Union shall be Hindi in Devanagari script” a position supported by a High Court ruling. However, languages listed in the Eighth Schedule of the Indian constitution are sometimes referred to, without legal standing, as the national languages of India. The top 10 languages spoken in India are Hindi, Bengali, Telugu, Marathim, Tamil, Urdu, Gujarati, Kannada, Malayalam, Oriya, and Punjabi.

india-population-2013-cricketSports in India

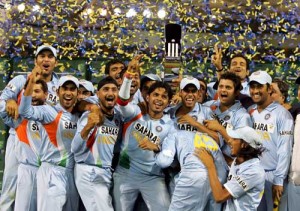
The most popular sport in the Republic of India is cricket.  Cricket is the sport that anyone of any skill level will play and can play.  In fact, cricket is considered to be the national sport.  Another sport that is considered the national sport is hockey.  The next most popular sport is chess.  The All India Chess Federation governs chess and India produces some of the top chess players.

India’s Population Growth

Historical Population of India

The population of the Republic of India has historically over the last half of a century always increased.  However, around 1975, the population started growing at a much larger rate and starting closing the population gap between China and itself.

Year Population (millions)
1960 447.8
1965 496.4
1970 553.9
1975 622.1
1980 700.1
1985 784.5
1990 873.8
1995 964.5
2000 1,054
2005 1,140
2010 1,225
2011 1,241

Projected Population of India

The population of the Republic of India is expected to continue its high growth rates due to the high birth rates in comparison to the death rates.  The birth rates range from 21.3 births per 1000 people to about 12.8 births per 1000 people.  However, the death rates only range from about 7.8 deaths per 1000 people to about 9.5 deaths per 1000 people.  Despite the projected population growth, the net migration remain will remain negative throughout the next 37 years.

Year Population (millions) Percent Increase
2015 1,307.337 2.9%
2020 1,385.193 5.96%
2025 1,456.682 5.2%
2030 1,520.586 4.4%
2035 1,575.707 3.6%
2040 1,621.638 2.9%
2045 1,657.966 2.2%
2050 1,684.197 1.6%

China Population 2013

china-population-2013China Population 2013

The current population of the People’s Republic of China is estimated to be approximately 1.354 billion people, which is an increase of about 0.01% from the last record of the population. China is the most populous country in the entire world, even though the population gap with India is growing closer every year. Historically over the last half of a century, though, the population of China has always been greater than the population of India. Based on the total land area and the total population of the country, the population density of the country is about 363.3 people per square mile.

Demographics in China

The largest ethnic group in the People’s Republic of China is the Han Chinese ethnic group, which makes up about 91.6% of the population or almost 1.16 billion people. Other than the Han Chinese, there are 55 unique ethnic minority groups that make up the remainder of the population. The government has ensured through policy that equal treatment is given to these minorities. The official language of the country is Standard Mandarin.

Religion in China

The oldest religion in the People’s Republic of China is Buddhism, which was brought to the country about 2,000 years ago. In fact, it is also the most important religion as it impacts society in many ways. Even if people are not declared Buddhists, many Chinese people have participated in some form of a Buddhist activity. The largest sect of Buddhism in the country is Han Buddhism, which consists of over 8,000 temples in the country. Despite the fact that Confucianism is not an actual religion, it has large importance and influence in the country. Some other important religions in the country are Taoism, Islam, and Christianity. However, Christianity was banned after 1949. This did not stop the believers of Christianity to practice their faith. There are approximately 15 million Catholics in the country. The majority of the Christians that practice their faith reside in the southern portion of China.

China’s Infrastructure

Infrastructure development remains a top priority for China’s government, which has long recognized that a modern economy runs on reliable roads and rails, electricity, and telecommunications. From the late 1990s, 100 million Chinese benefited from power and telecommunications upgrades. Between 2001 and 2004, investment in rural roads grew by a massive 51 percent annually. And in recent years, the government has used substantial infrastructure spending to hedge against flagging economic growth.

China’s leadership has charted equally ambitious plans for the future. Its goal is to bring the entire nation’s urban infrastructure up to the level of infrastructure in a middle-income country, while using increasingly efficient transport logistics to tie the country together.

Languages in China

Standard Chinese (known in China as Putonghua) is the official national spoken language for the mainland. Language laws of China do not apply to either Hong Kong or Macau and hence have different official languages (Cantonese) than the mainland.

China has 56 recognized ethnic groups and they speak a variety of different languages. The languages of China are collectively known as Zhongyu (simplified Chinese: 中语; traditional Chinese: 中語; pinyin: Zhōngyǔ), and their study is considered a distinct academic discipline in China. Zhongyu span eight primary language families, are diverse morphologically and phonetically, and may be mutually unintelligible to each other. The languages most studied and supported by the state include Chinese, Mongolian, Tibetan, Uyghur and Zhuang. China has 292 living languages and 1 extinct language (Jurchen) according to Ethnologue.

china-population-2013-sportsSports in China

The most popular sports in the People’s Republic of China are any type of racket sports, specifically table tennis (ping pong) and badminton. China has won the most amounts of gold medals in Badminton and Ping Pong in the world. Another popular and important sport in the country is football (American soccer). The sport has gained increasing popularity over the years, despite a lack of significant success in the international play.

China’s Population Problems

Historical Population of China

Historically over the past half of a century, the only time that the population of the People’s Republic of China has decreased is from the years 1960-1961. Every other year, however, the population has grown. However, near the latter half of the 20th century and the beginning of the 21st century, the population has begun to slow down its growth.

Year Population (millions)
1960 667.1
1965 715.2
1970 818.3
1975 916.4
1980 981.2
1985 1,051
1990 1,135
1995 1,205
2000 1,263
2005 1,304
2010 1,338
2011 1,344

Projected Population of China

As noted before, the population of the People’s Republic of China began to slow down its growth near the 21st century. In fact, this trend is expected to continue, as the population will only increase till about 2025. Then by 2030, the population will start to decrease at least for the next 15 years. One cause of this the negative net migration rates over the next 37 years. More people are emigrating than immigrating. Another reason is that the death rates eventually exceed the birth rates. The birth rates will decrease from 11.9 births per 1000 people in 2015 to about 8.7 births per 1000 people in 2050. However, the main reason for the decrease is that that death rates increase from 7.7 deaths per 1000 people in 2015 to about 14.7 deaths per 1000 people in 2050. The death rate nearly doubles in the course of 35 years.

Year Population (millions) Percent Increase
2015 1,364.98 0.81%
2020 1,381.59 1.20%
2025 1,387.83 0.45%
2030 1,383.62 -0.30%
2035 1,368.50 -1.10%
2040 1,345.39 -1.70%
2045 1,313.78 -2.30%
2050 1,273.05 -3.10%

US Population 2013

US Population 2013us-population-2013

The current population of the United States of America is estimated to be about 316,364,000 people, which is an increase of about 1.5% from the last record of population.  Historically, the population of the United States of America has always been greater than that of Brazil and Mexico.  Based on the total land area and the total population of the country, the population density of the country is estimated to be about 88.6 people per square mile.

Demographics of the United States

The largest ethnic group in the United States of America is those that identify as white, which makes up about 72% of the population. The next largest ethnic population is the Black American group, which makes up about 13% of the population. The Asian population makes up about 5% of the population and is thought to be the fastest growing ethnicity in the entire country. The rest of the population is made up of Hispanics and Latinos, American Indians, Alaskan Natives, Native Hawaiian, Pacific Islanders, and those that identify as multiracial. There is no official language of the country, but English is unofficially the national language since the majority of the population speaks English. However, Spanish is the language that is spoken the most frequently other than English.

Religion in the United States

The largest religious organization in the United States of America is considered to be the Christian religion, making up about 78% of the population. However, the majority of the Christians consider themselves to be Protestant. About 51% of the population identifies as Protestant while 24% of the population identifies as Catholic. Only about 2% of the population is Jewish, 0.7% of the population is Buddhist, and only 0.6% of the population is Muslim. However, about 16% of the population identifies as being unaffiliated with religions, 4% of which includes atheists and agnostics.

Sports in the United States

The most popular sport in the United States of America is heavily debated among baseball, football, basketball, and hockey. The major professional leagues in the country include the Major League Baseball, National Football League, National Basketball Association, and the National Hockey League. Soccer has gained more popularity throughout the years, but has nowhere near the following and popularity of the other sports.

Interactive US State Population Map

Scroll over the interactive map we have provided to see all the different USA state populations across the United States of America.  Click on an area to learn more about the specific local state area or use one of the links in the list below to explore further.

Land of Dreams

Historical Population of the United States 

The population of the United States of America has historically increased over the last half of a century.  Since the 1990s, however, the growth rate has increased, compared to the growth rate earlier in the 20th century.

Year Population (millions)
1960 180.7
1965 194.3
1970 205.1
1975 216
1980 226.5
1985 237.9
1990 249.6
1995 266.3
2000 282.2
2005 295.5
2010 309.3
2011 311.6

Projected Population of the Untied States

The population of the United States of America is expected to follow the same trends that the country has historically exhibited.  The birth rates are expected to stay fairly steady over the next 37 years as they range from 13.1 births per 1000 people to about 13.8 births per 1000 people.  The deaths rate are expected to waver a little more than the birth rates, ranging from 8.8 deaths per 1000 people to about 10.6 deaths per 1000 people.  However, the net migration rates are supposed to be fairly high ranging from 2.3 to about 3.2.

Year Population  (millions) Percent Increase
2015 322.003 1.80%
2020 334.947 4.00%
2025 347.258 3.70%
2030 358.321 4.50%
2035 368.452 2.80%
2040 378.107 2.60%
2045 387.75 2.50%
2050 397.979 2.60%

Useful US State Population Resources

To learn more about the population of the United States of America in 2013, click here

Canada Population 2013

Canada Population 2013canada-population-2013

The current population of Canada is estimated to be approximately 34,881,000 people, which is an increase of about 1.2% from the last record of population.  Historically, the population of the country has been greater than the population of Australia, but has oscillated in terms of the population of California.  Up until 1984, the population of Canada had been greater than the population of California.  However, ever since then, California’s population is greater than the population of Canada.  Based on the total land area and the total population of the country, the population density of Canada is estimated to be about 9.05 people per square mile.

Demographics of Canada

The largest ethnic group in Canada is those that are native Canadian, making up about 32% of the population.  Those that identify as English make up about 21% of the population.  Then, the French ethnicity makes up the next largest group, making up about 15.8% of the population.  The rest of the population is Scottish, Irish, German, Italian, Chinese, Ukrainian, Dutch, and of First Nations.  The population of Canada is as much of a melting pot as America is.  The official languages of the country are Canadian English and Canadian French.  The two languages have equal rights in all legal matters or business matters.

Religion in Canada

The largest religious group in Canada is the Roman Catholic Church, which makes up about 39% of the population.  The United Church of Christ makes up about 6% of the population; the Anglican Church makes up about 5% of the population.  The largest non-Christian religion is the Muslim religion, making up about 3% of the population.  1.5% of the population reported to be Hindu, 1.4% of the population reported to be Sikh, 1.1% of the population reported to be Buddhist, and 1.0% of the population reported to be Jewish.

Sports in Canada 

The National Sports of Canada Act, passed in 1994, named the official sports of Canada to be hockey and lacrosse.  Hockey is the official winter sport of Canada and lacrosse is the national summer sport.  Curling and Canadian football (similar to American football) are other popular sports.  Canada is also a participant in the Olympic Games and has faithfully done so since the beginning.

Languages in Canada

Canada’s two official languages are Canadian English and Canadian French. Official bilingualism is defined in the Canadian Charter of Rights and Freedoms, the Official Languages Act, and Official Language Regulations; it is applied by the Commissioner of Official Languages. English and French have equal status in federal courts, Parliament, and in all federal institutions. Citizens have the right, where there is sufficient demand, to receive federal government services in either English or French, and official-language minorities are guaranteed their own schools in all provinces and territories.

English and French are the first languages of 59.7 and 23.2 percent of the population respectively. Approximately 98 percent of Canadians speak English or French: 57.8 percent speak English only, 22.1 percent speak French only, and 17.4 percent speak both. The English and French official-language communities, defined by the first official language spoken, constitute 73.0 and 23.6 percent of the population respectively.

Canada Shared By Canadians

Interactive Canadian Province Population Map

Scroll your mouse over the interactive map of Canada that we have provided below to see all the different Canadian province and territory populations across the Canadian landscape.  Click on an area or territory to learn more about the specific local provincial area or use one of the links in the list below to explore further.

Historical Population of Canada

The population of Canada has historically increased every year over the last half of a century.  The population growth has been fairly steady over those years and has not experienced any population decay.

Year Population (millions)
1960 17.91
1965 19.68
1970 21.32
1975 23.21
1980 24.59
1985 25.94
1990 27.79
1995 29.35
2000 30.77
2005 32.31
2010 34.13
2011 34.48

Projected Population of Canada

The population of Canada is expected to follow the same population trends that it has exhibited over the last half of a century.  The population is projected to grow over the course of the next 37 years due to the high migration rates and the birth rate to death rate ratios.   The net migration rates are projected to range from 4.2 to 5.6, which is a rate much higher than most countries.  The birth rates are projected to range from 11.6 births per 1000 people to about 10.8 births per 1000 people.  In contrast, the death rates are projected to range from 8.4 deaths per 1000 people to about 11.3 deaths per 1000 people.

Year Population (millions) Percent Increase
2015 35.627 2.10%
2020 37.147 4.30%
2025 38.556 3.80%
2030 39.756 3.10%
2035 40.76 2.50%
2040 41.66 2.20%
2045 42.571 2.20%
2050 43.613 2.40%

Canadian Population Resources

To learn more about the population of Canada in 2013, click here