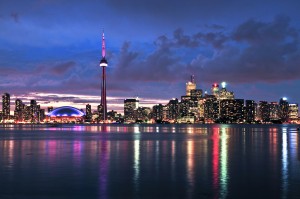
The current population of the city of Toronto is estimated to be about 2,791,140, which is an increase of about 6.7% from the last record of the population. The city is the most populous city in the entire country of Canada and the fourth most populous city in all of North America. Based on the total land area and the total population of the city, the population density of Toronto is approximately 11,630 people per square mile.
Demographics of Toronto
About 49% of the people living in Toronto are considered to be immigrants. For those immigrants living in the city of Toronto, the most frequent country of origin for the immigrants happens to be the Philippines and China. However, there are over 230 different ethnic origins living in the city of Toronto. In fact, 49% of the population is considered to be a visible minority. The largest of these visible minorities is South Asian, which makes up about 12% of the population. The Chinese population makes up about 11%, while the Black population makes up about 9% of the population. The top three ethnic origins are English (13%), Chinese (12%), and Canadian (11%).
Religion in Toronto
Of all those living in the city of Toronto, about 76% of that population identifies with a religious affiliation. The largest of these affiliations is the Roman Catholic Church, making up about 28% of the population. The next largest affiliation is the Protestant affiliation, which makes up about 12% of the population. The Muslim population makes up 8% of the population and the Hindu population makes up about 6% of the population. Lastly, the Jewish population makes up about 4% of the population.
Sports in Toronto
The city of Toronto has six professional sports teams: Toronto Maple Leafs, Toronto Raptors, the Toronto Rock, Toronto Blue Jays, Toronto Argos, and the Toronto Football Club. The Toronto Maple Leafs participate in the National Hockey League and the home stadium is the Air Canada Center. The Toronto Raptors participate in the National Basketball Association and the home stadium is also the Air Canada Center. The Toronto Rock play in the National Lacrosse League and also in Air Canada Center. The Toronto Blue Jays participate in Major League Baseball and play in the Rogers Center. The Toronto Argos participates in the Canadian Football League and also play in the Rogers Center. Lastly, the Toronto Football Club participate in Major League Soccer and play at BMO Field.
Toronto Climate
Toronto has a humid continental climate, with warm, humid summers and cold winters. The city experiences four distinct seasons, with considerable variance in day to day temperature, particularly during the colder weather season. Owing to urbanization and its proximity to water, Toronto has a fairly low day-night temperature difference. The denser urban scape makes for warmer nights year around and is not as cold throughout the winter than surrounding areas; however, it can be noticeably cooler on many spring and early summer afternoons under the influence of a lake breeze. Other low-scale maritime effects on the climate include lake-effect snow, fog and delaying of spring- and fall-like conditions, known as seasonal lag.
Toronto Economy
Historical Population of Toronto
Historically, the population of the city of Toronto has increased continuously since the foundation of the city. The first record of the population is in 1861 when the population was approximately 65,085. The population then grew to over 2.6 million people by the year 2011 and is now almost 2.8 million.
Year
Population
1861
65,085
1901
238,080
1931
856,955
1941
951,549
1951
1,176,622
1961
1,824,481
1971
2,089,729
1976
2,124,291
1981
2,137,395
1986
2,192,721
1991
2,275,771
1996
2,385,421
2001
2,481,494
2006
2,503,281
2011
2,615,060
Projected Population of Toronto
The population of the city of Toronto is expected to continue its rise in population over the next 23 years. By the year 2016, the population will have topped 3 million and by the year 2036, the population will have topped 3.5 million.
The United States Census Bureau estimates that the population of New Hampshire in 2013 was 1,320,718, which is ranked the 42nd largest population in the United States. This estimate shows a 0.3% increase since the last census in 2010, also conducted by the United States Census Bureau. The population density of the state is 147 people per square mile, ranked 21st largest density in the United States.
New Hampshire Population Projections
By the year 2015, the population is expected to reach approximately 1.42 million people, which is an approximate 7.6% increase from the current population. By the year 2020, the population is expected to reach 1.47 million people, which is an approximate 11.4% increase from the current population. By the year 2025, the population is expected to reach approximately 1.52 million people, which is an approximate 15.2% increase from the current population. By the year 2030, the population is expected to reach approximately 1.565 million people, which is an approximate 18.6% increase from the current population.
New Hampshire Land Mass
The state of New Hampshire is approximately 190 miles from north to south and 70 miles from east to west with a square area of 9,351 making it the 46h largest state in the Untied States. Of the 9,351 square miles, 382 square miles are covered by water. The highest point in the state of New Hampshire is Mount Washington, which reaches 6,288 feet above sea level. The lowest point in the state is at the Atlantic Ocean, reaching sea level. The geographic center of New Hampshire is located in Belknap County, 3 miles east of Ashland. Canada on the north, Massachusetts on the south, the Atlantic Ocean on the east, Vermont, and Maine on the west border the state.
New Hampshire can be broken up into three distinct geographic land areas: Coastal Lowlands, Eastern New England Uplands, and the White Mountains. The Coastal Lowlands makes up the southeastern portion of the state at the border with the Atlantic Ocean to about fifteen miles inland. This area is made up of beaches and islands off the coast of the land. The Eastern New England Uplands make up the majority of the southern portion of the state. This area is made up of the Merrimack Valley, the Hills and Lakes Region, and the Connecticut River Valley. Lastly, the White Mountains are extended from New Hampshire. These mountains cover the northern portion of the state. The highest point in New Hampshire is in this part of the state. The most northern portion of this section is filled with forested hills.
New Hampshire Demographics
Of the approximate 1.32 million people in the state of New Hampshire, about 50.6% of the population is female, while 49,4% is male. Also, approximately 94% of the population identifies as white (including Hispanic or Latino). But, out of that 94%, only about 3% do identify as Hispanic or Latino and the other 91% as Caucasian. Those that identify as Black or African American make up only 1% of the entire population of the state of New Hampshire. The rest of the population is made up of those that identify as Asian, American Indian, Alaskan Native, or those that identify as two or more races. These other races make up only about 5% of the New Hampshire population.
New Hampshire Religion
The population of New Hampshire identifies as religious at a much lower rate than the national average. About 35% of the state population identifies as religious, compared to the national average of 49%. Out of the 35%, about 24% identify as members of the Catholic Church, making it the largest denomination in New Hampshire. All the other Christian denominations make up about 10.5% of the population. Those who identify as Jewish, Islamic, or as an Eastern religion only make up 0.5% of the population.
Visit New Hampshire
New Hampshire Economy
Historically, mainly the paper and grain mills in the state drove New Hampshire’s economy. However, once the millwork began to fall, traditional manufacturing began to take over as the economic driver of the state. Currently, Smart Manufacturing and High Technology is the largest and most vital sector of New Hampshire’s economy. This company is big on producing electronic components through the usage of high-tech equipment. Another big part of the economy is tourism. Having coastal spots, mountains, and lake destinations makes New Hampshire a great place to visit. Lastly, New Hampshire has the lowest child poverty rate in the country.
Other Resources
Find out more about the population growth of the state of New Hampshire here.
Asia is the world’s largest and most populous continent with a population of 4.3 billion people. Located primarily in the eastern and northern hemispheres, Asia covers 8.7% of the Earth’s total surface area and comprises 30% of its land area. With approximately 4.3 billion people, it makes up 60% of the world’s current human population. Asia’s growth rate is very high for the modern era and has quadrupled during the last 100 years. Asia’s wealth of natural resources, ecological variability, and biological diversity put it in a great position to support such a high growth rate. Asia’s population growth and quickly growing economic development efforts are threatening the region’s rich and limited resources through their expansion and intensification of agriculture, uncontrolled growth of industrialization, destruction of natural habitats, and urban sprawl.
Asian populations will continue to grow for many decades to come which will lead to increasing pressure on the region’s natural resources. Based on historical growth rates and national calculations, it is estimated that between 2000 and 2050 the national populations are expected to grow in every country of East, Southeast, and South and Central Asia except for Japan and Kazakhstan. Populations will double or nearly double in Pakistan, Nepal, Bangladesh, Afghanistan, Cambodia, and Laos. Growth rates will also be particularly high in India, Indonesia, Iran, Malaysia, Mongolia, Myanmar, the Philippines, and Vietnam. Much of the population growth projected for the next few decades will occur in countries that are least capable of coping with additional stress on land, water, and other natural resources. According to a recent studies, countries where population is projected to grow fastest have some of the lowest income levels in the world. These countries already rank high in terms of environmental stress.
Asia Borders
Asia’s borders define four-fifths of the eastern side of Eurasia. It is located to the east of the Suez Canal, the Ural River, and the Ural Mountains, and south of the Caucasus Mountains and the Caspian and Black Seas. It is bounded on the east by the Pacific Ocean, on the south by the Indian Ocean and on the north by the Arctic Ocean.
Asia Economy
Asia has the second largest nominal GDP of all continents, after Europe, but the largest when measured in purchasing power parity. As of 2011, the largest economies in Asia are China, Japan, India, South Korea and Indonesia. Based on Global Office Locations 2011, Asia dominated the office locations with 4 of top 5 were in Asia, Hong Kong, Singapore, Tokyo, Seoul and Shanghai. Around 68 percent of international firms have offices in Hong Kong.
Asia Air Pollution
Asian cities are among the most polluted in the world. Of the 15 largest cities on the planet with the worst air pollution 12 are in Asia. Suspended particulate levels in Delhi, Beijing, Karachi, and Jakarta are many times higher than recommended by the World Health Organization. In the countryside, nitrates from animal waste and chemical fertilizers pollute the soil and water, and in the cities, the air is contaminated with lead from vehicle exhaust. In India’s largest cities, Mumbai and Delhi, about one-half of children under age 3 show signs of harmful exposure to lead. Such elevated levels of lead in the blood can be harmful to the developing brain and central nervous system of young children and can cause damage to other body organs. In the poorest countries of Asia, indoor air pollution may pose an even greater hazard for human health. Cooking and heating with wood, crop residues, animal dung, and low-quality coal produce smoke that contains dangerous particles and gases. When fuels such as these are burned indoors, using inefficient stoves and poor ventilation, they can cause tuberculosis, other serious respiratory diseases, and blindness. In fact, indoor air pollution from cooking and heating with unsafe fuels has been designated by the World Bank as one of the four most critical environmental problems in developing countries.
Asian Elephants
The Asian elephant is one of two species of elephants alive today. They vary greatly in size between the four subspecies, although all are smaller than the large African elephant. Throughout their range, Asian elephants experience an array of temperatures, although their habitats are found in tropical areas near the equator.
The Asian elephant can live in a wide variety of habitats, including jungle and mountain forests, but they tend to prefer forest edges bordered by grasslands and short woody plants. Due to conflicts with humans, these elephants have progressively moved into more remote areas where human interaction and conflict is at a minimum. The forested blocks can be moist, lowland evergreen forests to the much drier forests found at elevations up to 10,000 feet.
With births outnumbering deaths two to one and a 14% increase in migration, Australia’s population is now growing by more than 1,000 people per day. National census and calculation estimates predict that there is a birth in Australia every minute and 44 seconds. Data shows that a new immigrant arrives every two minutes and 19 seconds and a there is a mortality rate of one death every three minutes and 32 seconds. Using these factors experts calculate the Australian Population to be 23 million and the Continental Region’s population to be 36 million as of April 2013. The total population in Australia of 23 million people in 2013 has grown from the year 1960 where the population was 10.3 million. This 122 percent change during the last 50 years has lead to current population growth and economic prosperity. The population of Australia represents less than 1 percent of the world’s total population. With a current population of 23 million people, approximately one person in every 300 people on the planet lives on the continent of Australia.
Australia The Continent And Country
Australia is a continent comprising mainland Australia, Tasmania, New Guinea, Seram, possibly Timor, and neighboring islands. The continent is sometimes known in technical contexts by the names Sahul, Australinea or Meganesia, to distinguish it from the Australian mainland. It is the smallest of the seven traditional continents in the English conception. New Zealand is not part of the continent of Australia, but of the separate, submerged continent of Zealandia. Zealandia and Australia are both part of the wider regions known as Australasia and Oceania.
Australia is also a country comprising the mainland of the Australian continent, the island of Tasmania, and numerous smaller islands and is officially called the Commonwealth of Australia. It is the world’s sixth-largest country by total area. Neighbouring countries include Indonesia, East Timor and Papua New Guinea to the north; the Solomon Islands, Vanuatu and New Caledonia to the north-east; and New Zealand to the south-east.
Australia Population Growth
Currently 27% of Australia’s population is overseas-born which over a quarter of the total population. This proportion is considerably higher than many of the much more recognized nations that are popular for immigrants. The US is currently at 13% and Canada is at 20%. Immigration added 228 thousand people to Australia’s population in 2012 and contributed to 60% of the Australian population growth.
Australia Land Mass
With a total land area of 8,560,000 square kilometres (3,310,000 sq mi), the Australian continent is the smallest and lowest-lying human-inhabited continent on Earth. The continental shelf connecting the islands, half of which is less than 50 metres (160 ft) deep, covers some 2,500,000 square kilometres (970,000 sq mi), including the Sahul Shelf and Bass Strait. Since the country of Australia includes mostly a single landmass which comprises most of the continent, Australia is sometimes informally referred to as an “island” continent surrounded by oceans.
Australian Demographics
The population of Australia is estimated to be 23,000,000. Australia is the 52nd most populous country in the world. Its population is concentrated mainly in urban areas and is expected to exceed 28 million by 2030. Australia’s population has grown from an estimated population of about 350,000 at the time of British settlement in 1788 due to numerous waves of immigration. The European component of the population is declining as a percentage due to immigration from various countries. Australia has scarcely more than two persons per square kilometre of total land area. With 89% of its population living in urban areas, Australia is one of the world’s most urbanised countries. The life expectancy of Australians is also among the highest in the world.
The largest ethnic ancestral group that Australians identify with is the English group, making up about 36% of the population. The next largest group that the population identifies as is native Australian, making up about 35% of the population. The rest of the population is made up of Irish, Scottish, Italian, German, Chinese, Indian, Greek, and Dutch. The official language of the country is English. However, there are some other native languages that are spoken in the country.
Australian Wildlife
Australia’s unique animals are one of the many reasons people visit Australia. Australia has more than 378 mammal species, 828 bird species, 4000 fish species, 300 species of lizards, 140 snake species, two crocodile species and around 50 types of marine mammal. More than 80 per cent of the plants, mammals, reptiles and frogs are unique to Australia and are found no-where else. Some of Australia’s best-known animals are the kangaroo, koala, echidna, dingo, platypus, wallaby and wombat. Australia’s native animals can often be difficult to spot in the wild, but you are guaranteed to see them in the world-class zoos and wildlife parks across Australia’s major cities and regional areas.
Australian Climate
The climate of Australia varies widely due to its large geographical size. The largest part of Australia is covered in desert or semi-arid land. Only the south-east and south-west corners have a temperate climate and moderately fertile soil. The northern part of the country has a tropical climate, varied between tropical rain forests, grasslands, part desert.
Temperatures in Australia have followed an increasing trend since the 1900s. Overnight minimum temperatures have warmed more rapidly than daytime maximum temperatures in recent years. The warming has been largely attributed to the increased greenhouse effect. According to the Bureau of Meteorology, 80% of the land have a rainfall less than 600 mm (24 in) per year and 50% have even less than 300 mm (12 in). Australia has an annual average rainfall of 419 mm (16 in).
Religion in Australia
The Commonwealth of Australia has no official religion as it encourages freedom of religion and respect for those of diverse religions. However, about 64% of the population is Christian. Out of this 64%, Catholics make up about 26%, Anglicans make up about 19%, and the United Church of Christ makes up about 6% of the Australian population. The largest non-Christian faith is the Buddhist faith, which makes up about 2% of the population. About 30% do not identify as religious or of any particular religious group.
Australia’s Largest City
Sydney is the state capital of New South Wales and the most populous city in Australia. It is on Australia’s south-east coast, on the Tasman Sea. The greater metropolitan area has an approximate population of 4.6 million people. Inhabitants of Sydney are called Sydneysiders, comprising a cosmopolitan and international population. There are many fine heritage sites in Sydney. Vistiors can begin their journey at the World Heritage-listed Hyde Park Barracks on Macquarie Street before heading to attractions such as the Museum of Sydney, The Rocks precinct and Vaucluse House. If you enjoy contemporary or classical art, cutting-edge installations or beautifully-crafted Aboriginal art, you’ll find an art gallery to suit your style in Sydney. Sydney has an almost endless variety of attractions to entertain visitors of all ages. Come face-to-face with Australia’s diverse wildlife, go behind-the-scenes at an art gallery, see a performance at the Sydney Opera House, immerse yourself at a museum or visit a World Heritage-listed convict heritage site in the heart of the city.
Sports in Australia
The most popular sport in the Commonwealth of Australia is rugby. Rugby in Australia has three different divisions: Rugby Union, Australian Rules, and Rugby Leagues. Another popular sport in Australia is cricket. The country is given the rank of the best cricket team in the world. While soccer is popular in the country, it is not nearly as popular as rugby.
Population Growth and Imigration in Australia
Historical Population of Australia
Historically over the last half of a century, the population of the Commonwealth of Canada has always increased. There were periods of faster growth than others, but there has always been growth over the last half of a century.
Year
Population (millions)
1960
10.28
1965
11.39
1970
12.51
1975
13.89
1980
14.69
1985
15.76
1990
17.07
1995
18.07
2000
19.15
2005
20.39
2010
22.07
2011
22.32
Projected Population of Australia
The population of the Commonwealth of Australia is expected to continue the trend of population growth that it has exhibited over the last half of a century. This growth can be attributed to the higher than usual net migration rates and the birth to death rate ratio. The net migration rates range from 1.8 to about 6.5, which are a much larger range and have a higher rate than most other countries. The birth rates range from 13.7 births per 1000 people to about 12.7 births per 1000 people. However, the death rates only range from about 7.3 deaths per 1000 people to 9.6 deaths per 1000 people.
Year
Population (millions)
Percent Increase
2015
23.763
2.8%
2020
25.185
5.98%
2025
26.486
5.2%
2030
27.596
4.2%
2035
28.557
3.5%
2040
29.418
3.0%
2045
30.211
2.7%
2050
30.949
2.4%
Other Australia Resources
To learn more about the population of Australia, click here
Europe is the third-most populous continent after Asia and Africa, with a population of 733 million or about 11% of the world’s population. Europe is bordered by the Arctic Ocean to the north, the Atlantic Ocean to the west, the Mediterranean Sea to the south, and the Black Sea and connected waterways to the southeast. Europe is a peninsula that makes up the western fifth of the Eurasian landmass. Its maritime borders are made up of the Arctic Ocean to the north, the Atlantic Ocean to the west, and the Mediterranean, Black, and Caspian Seas to the south. The southern regions are more mountainous, while moving north the terrain descends from the high Alps, Pyrenees, and Carpathians, through hilly uplands, into broad, low northern plains, which are vast in the east. This extended lowland is known as the Great European Plain, and at its heart lies the North German Plain. An arc of uplands also exists along the north-western seaboard, which begins in the western parts of the islands of Britain and Ireland, and then continues along the mountainous, fjord-cut spine of Norway.
Europe Land and Mass
Europe is the world’s second-smallest continent by surface area, covering about 10,180,000 square kilometres (3,930,000 sq mi) or 2% of the Earth’s surface and about 6.8% of its land area. Of the 50 European countries, Russia is by far the largest by both area and population, taking up 40% of the continent and Vatican City is the smallest.
European Population Growth
Europe’s population growth rate is approximated 0.212%. The average annual percent change in the population, resulting from a surplus or deficit of births over deaths and the balance of migrants entering and leaving a country. The rate may be positive or negative. The growth rate is a factor in determining how great a burden would be imposed on a country by the changing needs of its people for infrastructure, resources, and jobs. Rapid population growth can be seen as threatening by neighboring countries.
European Wildlife
Europe stretches from the Ural Mountains in the east to the Atlantic Ocean in the south and encompasses a variety of habitats including tundra, taiga, montane forest, temperate forest, and steppe. Its wildlife includes alpine newts, European tree frogs, Eurasian lynxes, badgers, European otters, chamois, European bison, hedgehogs and wild boars.
There are nearly fourteen thousand Brown Bears that now live in Europe in ten separate populations. Their habitat spans from the west of Spain to the east of Russia and from the north of Scandinavia to southern Romania and Bulgaria. In France the bears are critically endangered. There are not many wild bears in Central Europe and none at all on the British Isles.
Europeans still live near places where you can hear wolfs howl at night, where bears walk on forest paths and where, in the fall of summer, you can see mighty buffalo engaged in a fight. For centuries, wild nature has been pushed back into the most remote places however, despite that, modern society has managed to develop not only a new relationship to restrained nature, it has also come up with new ways to protect it.
European Climate
The climate is milder in comparison to other areas of the same latitude around the globe due to the influence of the Gulf Stream. The Gulf Stream is nicknamed “Europe’s central heating”, because it makes Europe’s climate warmer and wetter than it would otherwise be. The Gulf Stream not only carries warm water to Europe’s coast but also warms up the prevailing westerly winds that blow across the continent from the Atlantic Ocean.
Therefore the average temperature throughout the year of Naples is 16 °C (60.8 °F), while it is only 12 °C (53.6 °F) in New York City which is almost on the same latitude. Berlin, Germany; Calgary, Canada; and Irkutsk, Russia all lie on around the same latitude; January temperatures in Berlin average around 8 °C (15 °F) higher than those in Calgary, and they are almost 22 °C (40 °F) higher than average temperatures in Irkutsk.
European Currency
The official currency of the European Union is the euro used in all its documents and policies. The Stability and Growth Pact sets out the fiscal criteria to maintain for stability and economic convergence. The euro is also the most widely used currency in the EU, which is in use in 17 member states known as the Eurozone. All other member states, apart from Denmark and the United Kingdom, which have special opt-outs, have committed to changing over to the euro once they have fulfilled the requirements needed to do so. Also, Sweden can effectively opt out by choosing when or whether to join the European Exchange Rate Mechanism, which is the preliminary step towards joining. The remaining states are committed to join the Euro through their Treaties of Accession.
Changes in European Populatoin Demographics
Other Europe Resources
To learn more about the population of Europe, click here


 Toronto Population
 New Hampshire Population 2013
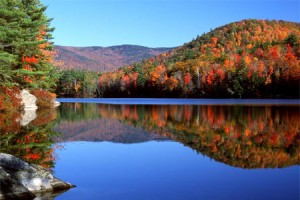 New Hampshire Demographics
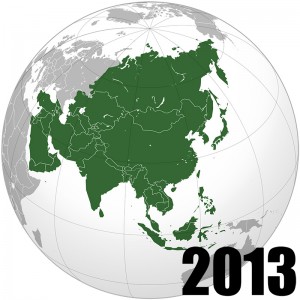 Asia Population 2013
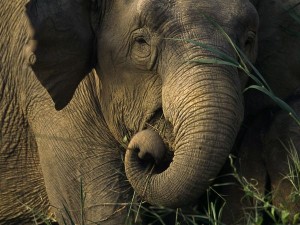 Asian Elephants
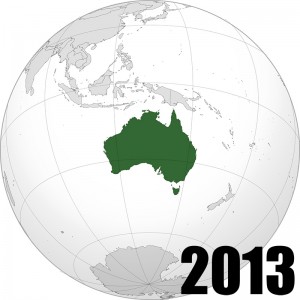 Australia Population 2013
 Australian Wildlife
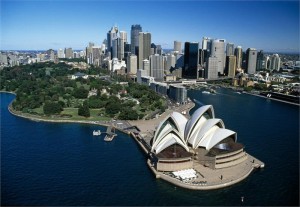 Australia’s Largest City
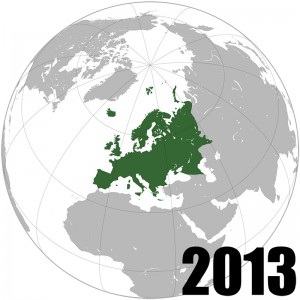 Europe Population 2013
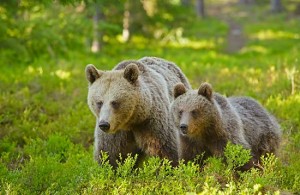 European Wildlife