Australia Population 2013
With births outnumbering deaths two to one and a 14% increase in migration, Australia’s population is now growing by more than 1,000 people per day. National census and calculation estimates predict that there is a birth in Australia every minute and 44 seconds. Data shows that a new immigrant arrives every two minutes and 19 seconds and a there is a mortality rate of one death every three minutes and 32 seconds. Using these factors experts calculate the Australian Population to be 23 million and the Continental Region’s population to be 36 million as of April 2013.
The total population in Australia of 23 million people in 2013 has grown from the year 1960 where the population was 10.3 million. This 122 percent change during the last 50 years has lead to current population growth and economic prosperity. The population of Australia represents less than 1 percent of the world’s total population. With a current population of 23 million people, approximately one person in every 300 people on the planet lives on the continent of Australia.
Australia The Continent And Country
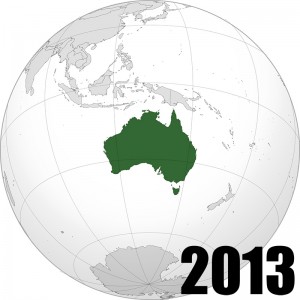
Australia is a continent comprising mainland Australia, Tasmania, New Guinea, Seram, possibly Timor, and neighboring islands. The continent is sometimes known in technical contexts by the names Sahul, Australinea or Meganesia, to distinguish it from the Australian mainland. It is the smallest of the seven traditional continents in the English conception. New Zealand is not part of the continent of Australia, but of the separate, submerged continent of Zealandia. Zealandia and Australia are both part of the wider regions known as Australasia and Oceania.
Australia is also a country comprising the mainland of the Australian continent, the island of Tasmania, and numerous smaller islands and is officially called the Commonwealth of Australia. It is the world’s sixth-largest country by total area. Neighbouring countries include Indonesia, East Timor and Papua New Guinea to the north; the Solomon Islands, Vanuatu and New Caledonia to the north-east; and New Zealand to the south-east.
Australia Population Growth
Currently 27% of Australia’s population is overseas-born which over a quarter of the total population. This proportion is considerably higher than many of the much more recognized nations that are popular for immigrants. The US is currently at 13% and Canada is at 20%. Immigration added 228 thousand people to Australia’s population in 2012 and contributed to 60% of the Australian population growth.
Australia Land Mass
With a total land area of 8,560,000 square kilometres (3,310,000 sq mi), the Australian continent is the smallest and lowest-lying human-inhabited continent on Earth. The continental shelf connecting the islands, half of which is less than 50 metres (160 ft) deep, covers some 2,500,000 square kilometres (970,000 sq mi), including the Sahul Shelf and Bass Strait. Since the country of Australia includes mostly a single landmass which comprises most of the continent, Australia is sometimes informally referred to as an “island” continent surrounded by oceans.
Australian Demographics
The population of Australia is estimated to be 23,000,000. Australia is the 52nd most populous country in the world. Its population is concentrated mainly in urban areas and is expected to exceed 28 million by 2030. Australia’s population has grown from an estimated population of about 350,000 at the time of British settlement in 1788 due to numerous waves of immigration. The European component of the population is declining as a percentage due to immigration from various countries. Australia has scarcely more than two persons per square kilometre of total land area. With 89% of its population living in urban areas, Australia is one of the world’s most urbanised countries. The life expectancy of Australians is also among the highest in the world.
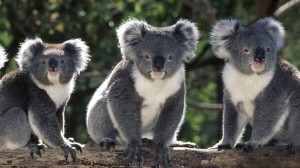 Australian Wildlife
Australia’s unique animals are one of the many reasons people visit Australia. Australia has more than 378 mammal species, 828 bird species, 4000 fish species, 300 species of lizards, 140 snake species, two crocodile species and around 50 types of marine mammal. More than 80 per cent of the plants, mammals, reptiles and frogs are unique to Australia and are found no-where else. Some of Australia’s best-known animals are the kangaroo, koala, echidna, dingo, platypus, wallaby and wombat. Australia’s native animals can often be difficult to spot in the wild, but you are guaranteed to see them in the world-class zoos and wildlife parks across Australia’s major cities and regional areas.
Australian Climate
The climate of Australia varies widely due to its large geographical size. The largest part of Australia is covered in desert or semi-arid land. Only the south-east and south-west corners have a temperate climate and moderately fertile soil. The northern part of the country has a tropical climate, varied between tropical rain forests, grasslands, part desert.
Temperatures in Australia have followed an increasing trend since the 1900s. Overnight minimum temperatures have warmed more rapidly than daytime maximum temperatures in recent years. The warming has been largely attributed to the increased greenhouse effect. According to the Bureau of Meteorology, 80% of the land have a rainfall less than 600 mm (24 in) per year and 50% have even less than 300 mm (12 in). Australia has an annual average rainfall of 419 mm (16 in).
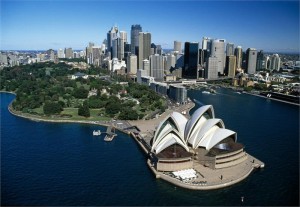 Australia’s Largest City
Sydney is the state capital of New South Wales and the most populous city in Australia. It is on Australia’s south-east coast, on the Tasman Sea. The greater metropolitan area has an approximate population of 4.6 million people. Inhabitants of Sydney are called Sydneysiders, comprising a cosmopolitan and international population. There are many fine heritage sites in Sydney. Vistiors can begin their journey at the World Heritage-listed Hyde Park Barracks on Macquarie Street before heading to attractions such as the Museum of Sydney, The Rocks precinct and Vaucluse House. If you enjoy contemporary or classical art, cutting-edge installations or beautifully-crafted Aboriginal art, you’ll find an art gallery to suit your style in Sydney. Sydney has an almost endless variety of attractions to entertain visitors of all ages. Come face-to-face with Australia’s diverse wildlife, go behind-the-scenes at an art gallery, see a performance at the Sydney Opera House, immerse yourself at a museum or visit a World Heritage-listed convict heritage site in the heart of the city.
Population Growth and Imigration in Australia
Other Australia Resources
To learn more about the population of Australia, click here
Learn more about Antarctica Population 2013.
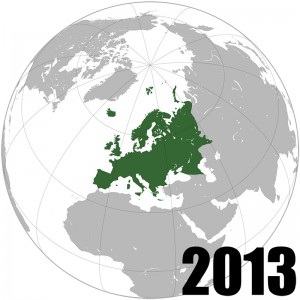
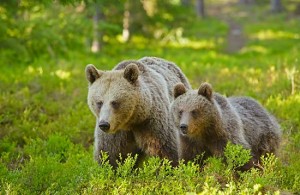 European Wildlife
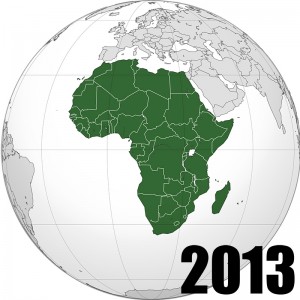
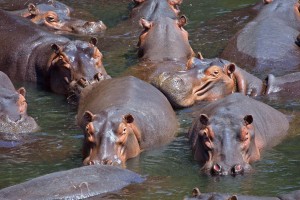 African Wildlife
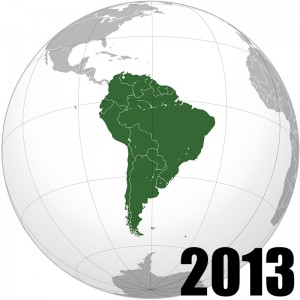
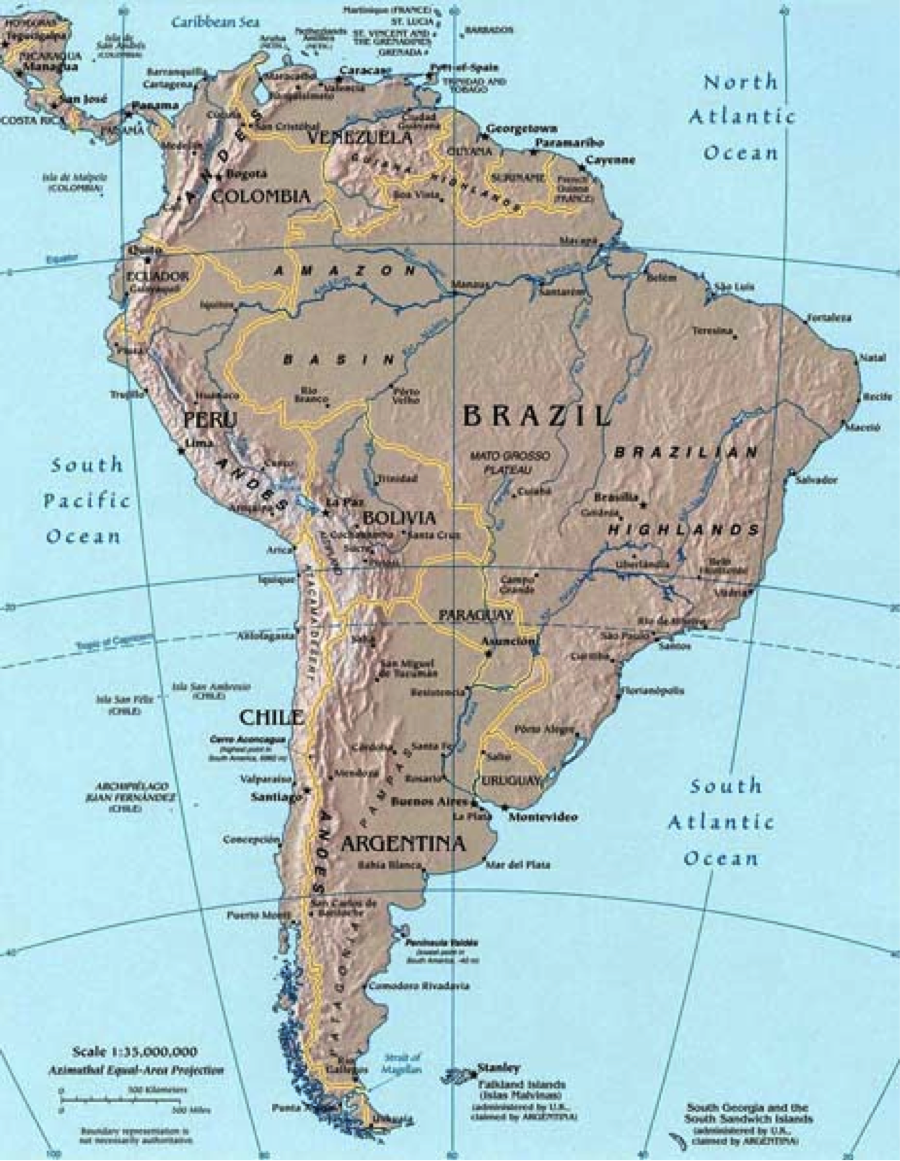
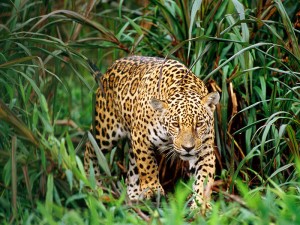 South America Wildlife
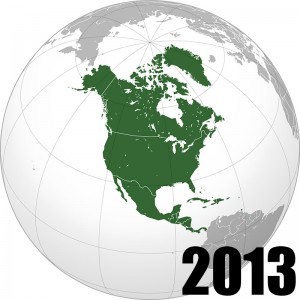
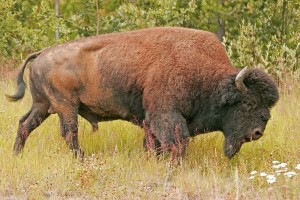 North America Wildlife